By Cristian Daron
The oral probiotic product pages were part of the PuurSmile Shopify testing programme I built and maintained. A landing-page report gives us a way to describe their performance at the individual URL level, alongside the store-wide figures and controlled A/B tests already in this portfolio.
The measured result
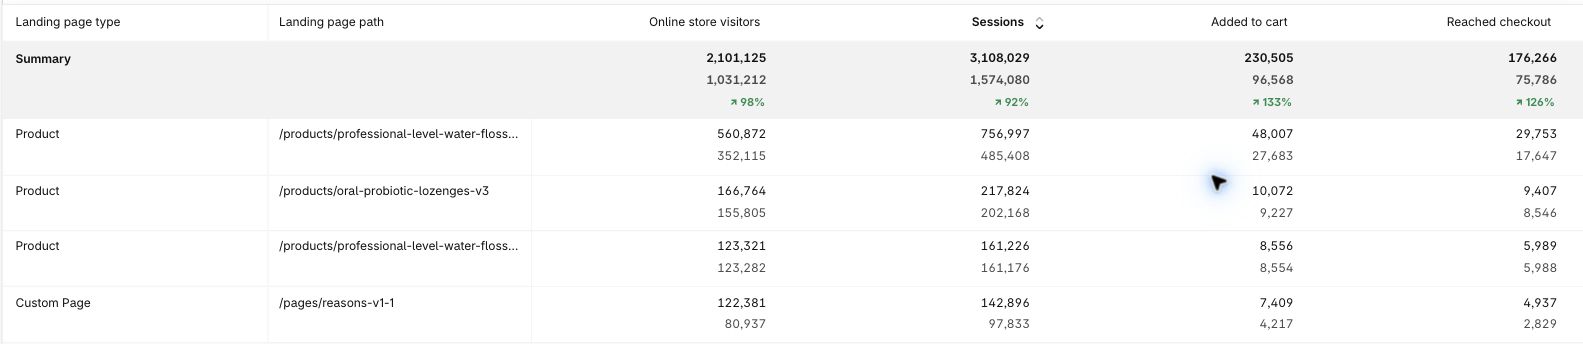
From 1 March to 19 September 2026, /products/oral-probiotic-lozenges-v3 recorded 202,168 human landing sessions. Shopify recorded 9,227 of those sessions with a cart addition and 8,546 reaching checkout. Dividing each count by landing sessions gives a 4.56% cart-addition rate and a 4.23% checkout-reaching rate. Reaching checkout measures purchase intent; it does not establish that an order was completed.
The decisions behind the build
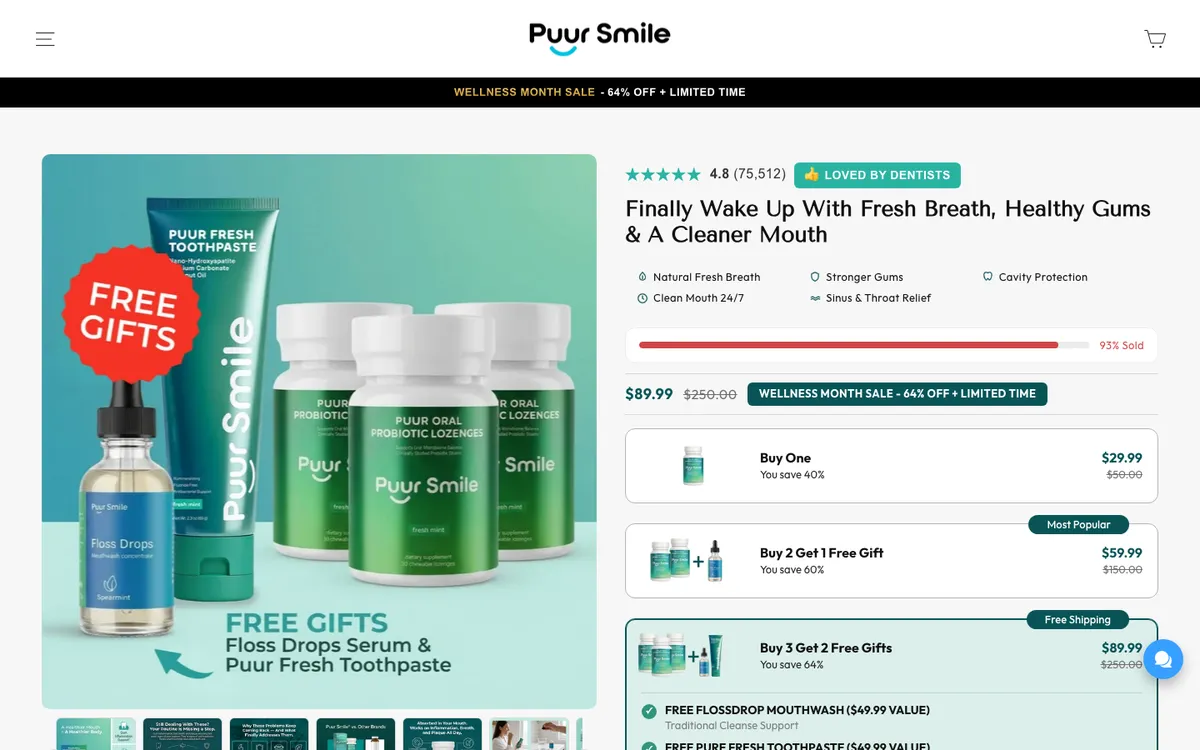
An oral probiotic needs more explanation than a familiar everyday product. My work on the product pages brought product education together with bundle and subscription selectors and a sticky mobile add-to-cart. The education gives visitors context for the offer, the selectors let them choose how to buy, and the mobile action stays available while they read. Each choice addresses a specific part of the buying decision.
These are the reasons for the design. The report does not establish which feature caused a visitor to continue, or how the page would have performed without it. Advertising, audience, product, pricing and offer also contribute to the observed rates.
A second page with a different role
The reasons-to-buy page at /pages/reasons-v1-1 recorded 97,833 human landing sessions in the same window. Of those, 4,217 included cart additions (4.31%) and 2,829 reached checkout (2.89%). This describes sessions that began on the pre-lander and continued through the store; the cart and checkout actions did not have to happen on the landing page itself.
Keeping the proof attached to the claim
I reviewed the Shopify report on 16 October 2026. Its main window was Last 365 days, with 1 March to 19 September 2026 as the comparison. The engagement numbers quoted here are the lower comparison line in each row. The windows overlap and have different lengths, so their green growth percentages are not a before-and-after redesign result. The case study includes the original table crop, the report date settings and a downloadable transcription of the figures.
The measured oral probiotic URL is v3. Other portfolio links show the later v3-1-3 page, and its results should not be assumed to be the same. The report also aggregates any revisions served at v3 during the period. That distinction keeps the case study useful: a reviewer can see exactly which page and period the numbers describe.