Engagement analytics

    Six months on one store, and which of it was mine.

    Ordered from most clearly mine to least. The A/B tests come first, because both arms saw the same traffic. The store figures follow, and those are shared work. Revenue is left off on purpose: the store did roughly $2M a month, and that was a team result.

    Read from the store's own Shopify dashboard: 1 Mar to 19 Sep 2026, against 1 Sep 2025 to 28 Feb 2026.

    Experiments

    Three tests, including one that never separated.

    Run in Intelligems. A change whose interval crosses zero, or reaches down to it, has not been demonstrated, however good the headline looks.
    • Interval entirely above zero
    • Interval reaches or crosses zero
    Established win

    Add payment methods

    Subscription product page · 5 to 16 June 2026 · 11 days · 99.7% probability to beat control

    Control
    14,104 visitors · 287 orders · $13,498.12
    Variation
    13,969 visitors · 355 orders · $16,285.78

    Hypothesis

    Buyers who had already chosen were dropping at the point of payment because the options on offer did not include the one they intended to use.

    What changed

    Added further express payment methods to the product page, above the fold, rather than leaving them to appear only inside checkout.

    Conversion rate

    2.03% to 2.54%

    +24.89%interval +7% to +45%established

    Revenue per visitor

    $0.96 to $1.17

    +21.82%interval -2% to +52%spans zero, not established

    Average order value

    $47.03 to $45.88

    -2.46%interval -17% to +14%spans zero, not established

    Subscription share of orders

    99.0% to 99.4%, reported as no change

    Subscription order value

    down 3.06%, interval -17% to +13%, spans zero

    Read the full reading

    The clearest result of the three. The interval on conversion sits entirely above zero, so the effect is established rather than suggestive. Revenue per visitor moved with it but its interval just touches zero, and order value is flat, so the gain is more buyers rather than larger baskets. The subscription share of orders did not move either, so the extra buyers arrived on the same mix.
    Probable win on conversion, order value unproven

    Real scarcity counter

    Direct-response product page · 11 to 26 August 2026 · 15 days · 98% probability to beat control

    Control
    15,628 visitors · 370 orders · $37,689.59
    Variation
    16,894 visitors · 461 orders · $44,696.58

    Hypothesis

    A scarcity cue tied to real stock would be more persuasive than a generic one, because buyers discount urgency they suspect is invented.

    What changed

    Replaced the static low-stock message with a counter driven by actual inventory.

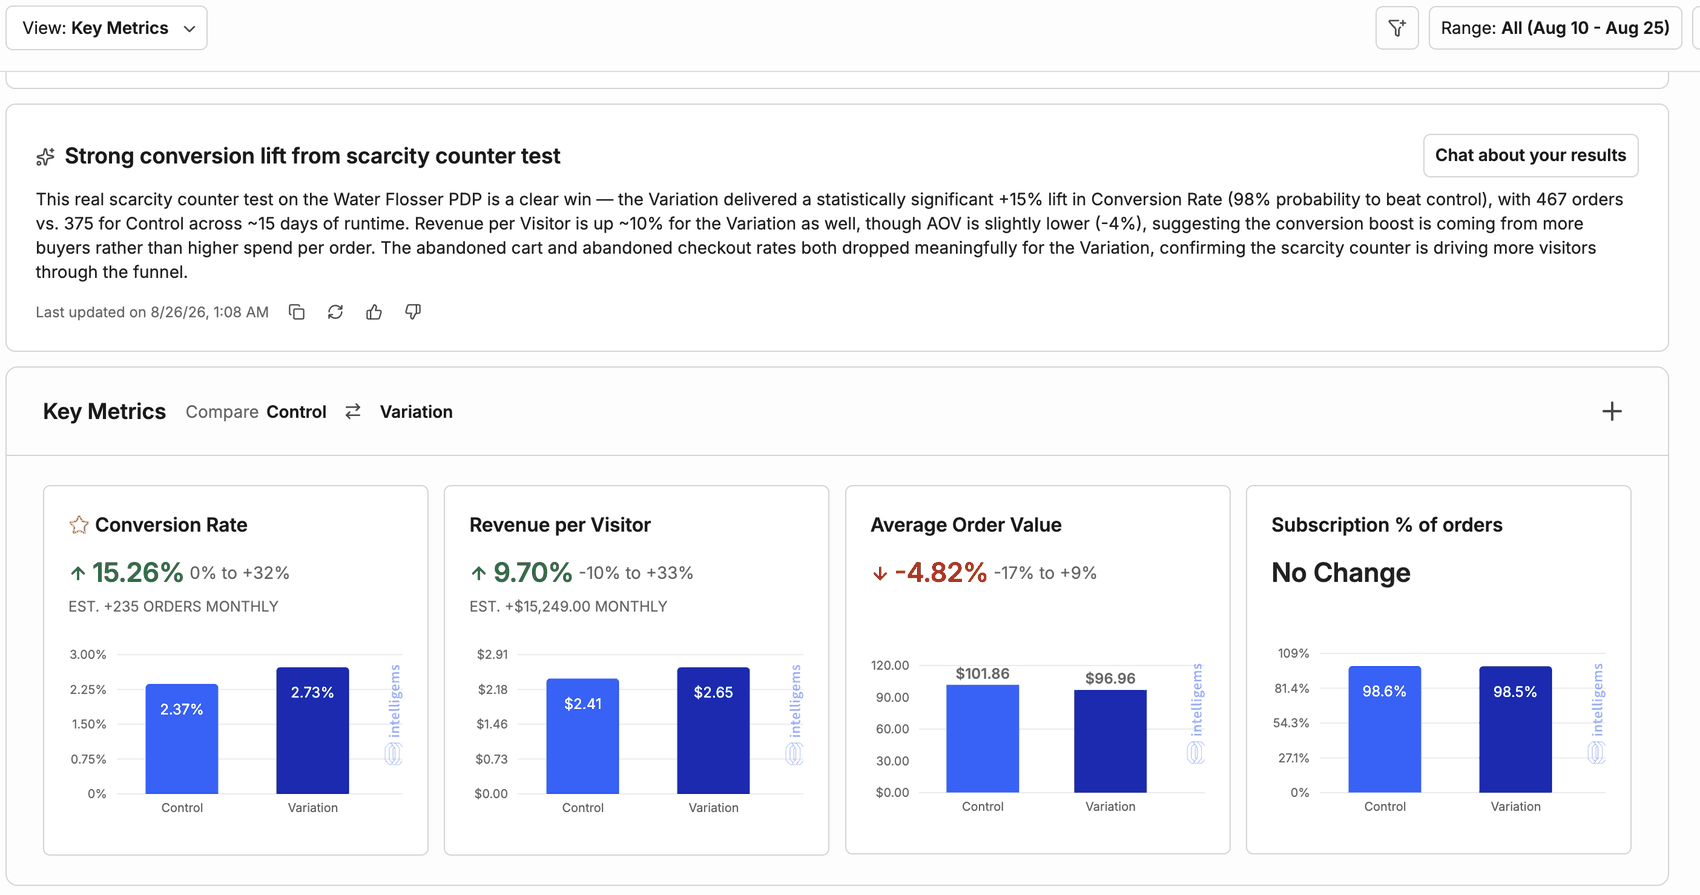
    Conversion rate

    2.37% to 2.73%

    +15.26%interval 0% to +32%lower bound at zero, not established

    Revenue per visitor

    $2.41 to $2.65

    +9.7%interval -10% to +33%spans zero, not established

    Average order value

    $101.86 to $96.96

    -4.82%interval -17% to +9%spans zero, not established

    Subscription share of orders

    98.6% to 98.5%, reported as no change

    Read the full reading

    More people bought, and each spent slightly less. Conversion carries 98% probability to beat control, but the reported interval reaches down to zero, so it is probable rather than proven, and revenue per visitor and order value both span zero outright. The subscription share of orders did not move, which matters here: the lift came from more buyers on the same mix, not from pushing people off the subscription. The platform's summary also recorded abandoned cart and abandoned checkout rates both falling, which is the mechanism you would expect if the cue were doing its work rather than simply being noticed. Shipped on that basis, with order value kept under watch.

    Intelligems results for the scarcity counter test: a generated summary panel above key metric cards for conversion rate, revenue per visitor, average order value and subscription share of orders
    The platform's own view of this test. Its summary calls the lift statistically significant; the interval printed beneath it runs from 0% to +32%, which is why this page treats conversion as probable rather than established. That summary was also generated before the test closed, so its order counts sit slightly ahead of the final ones.
    No topline result, unit economics moved

    Pricing test

    Subscription product page · 11 to 27 August 2026 · 16 days · 66.1% probability to beat control

    Control
    8,201 visitors · 216 orders · $11,579.86
    Variation
    8,668 visitors · 238 orders · $13,089.42

    Hypothesis

    A different price point would lift revenue per visitor without costing conversion.

    What changed

    A redirect test: half of traffic went to a variant of the product page carrying a higher price point, rather than changing the price in place.

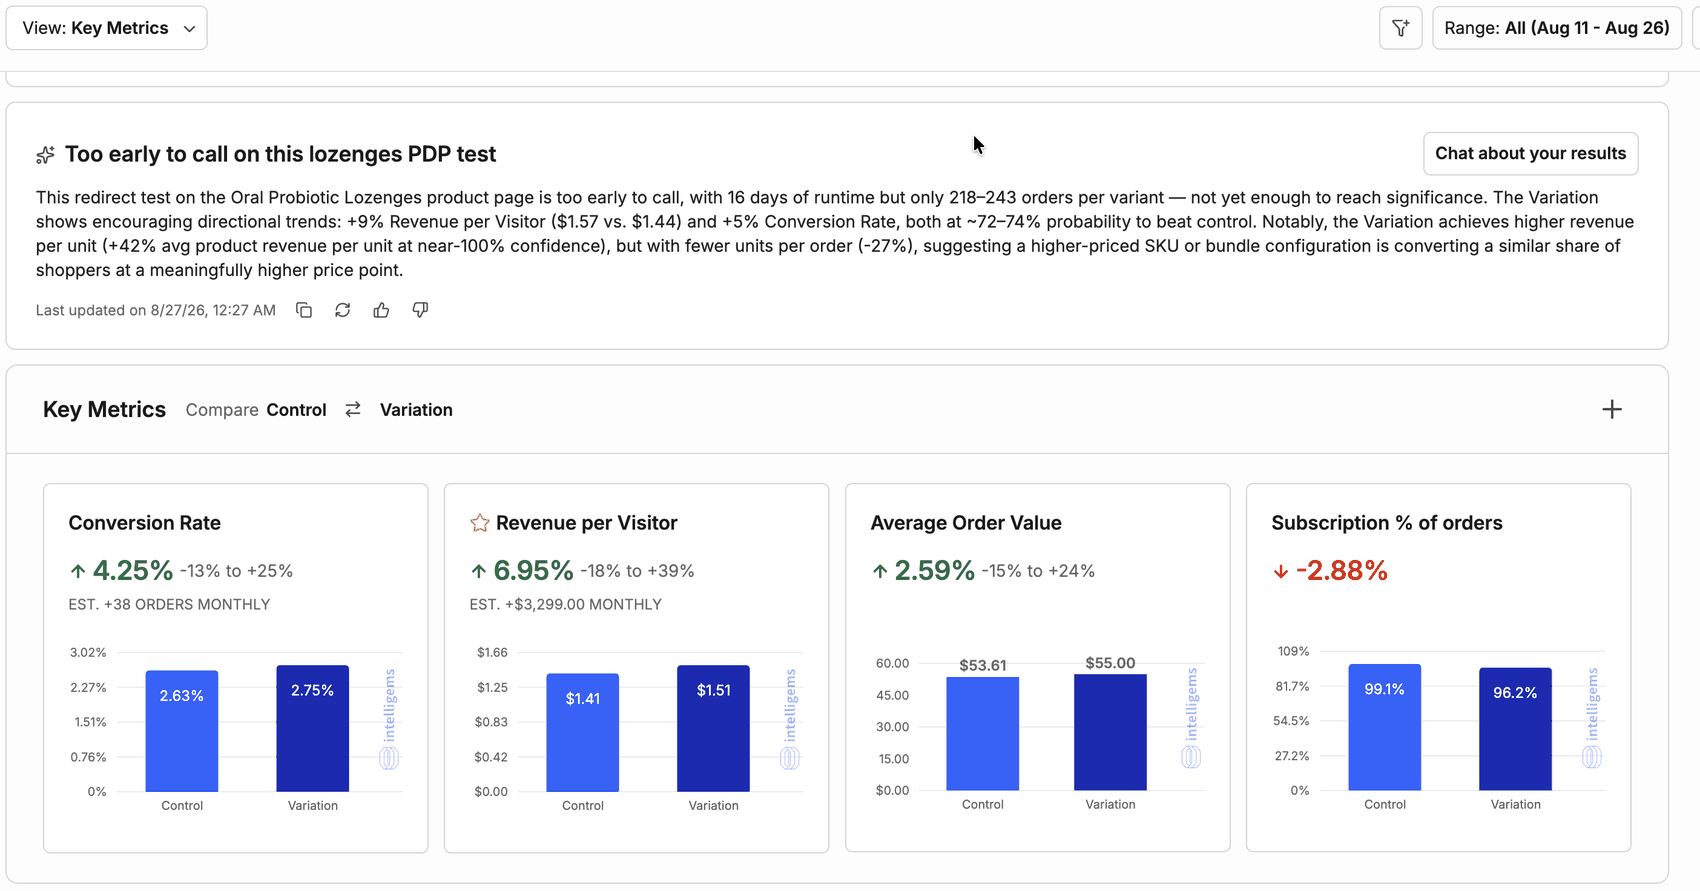
    Conversion rate

    2.63% to 2.75%

    +4.25%interval -13% to +25%spans zero, not established

    Revenue per visitor

    $1.41 to $1.51

    +6.95%interval -18% to +39%spans zero, not established

    Average order value

    $53.61 to $55.00

    +2.59%interval -15% to +24%spans zero, not established

    Subscription share of orders

    99.1% to 96.2%, down 2.88%

    Read the full reading

    The topline never separated from control: conversion, revenue per visitor and order value all have intervals spanning zero at 66.1% probability to beat control, on 216 to 238 orders per arm over 16 days, which is simply not enough to call. What did separate was the unit economics. The platform's own summary put revenue per unit up 42% at close to full confidence on 27% fewer units per order, and the subscription share of orders fell 2.88%. So the higher price behaved exactly as a higher price should, earning more per unit from a slightly smaller and slightly less subscription-weighted basket, without measurably costing conversion. That is a reason to re-run at a larger sample, not a result to act on, so the price stayed where it was. Reported here because a testing programme that shows only winners is not a testing programme.

    Intelligems results for the pricing test: a generated summary panel above key metric cards for conversion rate, revenue per visitor, average order value and subscription share of orders
    The platform's own view of this test. Its summary panel was generated the day before the test closed, so the topline figures quoted there run slightly ahead of the final ones in the cards beneath it; the revenue per unit and units per order findings come from that panel.

    Funnel

    More people surviving each step.

    Traffic grew 20% while completed checkouts grew 92%, so most of the change is a higher rate at each step. Offers and pricing move these rates too.
    • Engagement
    • Prior six months, derived

    Sessions

    1,965,578

    up 20%

    Added to cart

    166,037

    up 70%

    Reached checkout

    123,582

    up 61%

    Completed checkout

    70,702

    up 92%

    The store

    The rest of the numbers, for context.

    Shared across the whole team. Discounts ran at nearly half of gross sales: the free-gift volume the single-rule discount engine was built to carry.

    Conversion rate

    3.59%

    up 59%

    Sessions

    1,965,578

    up 20%

    Orders

    170,793

    up 35%

    Orders fulfilled

    162,087

    up 46%

    Average order value

    $78.07

    down 1.4%

    Returning customer rate

    74.57%

    down 9%

    Traffic

    Where the sessions came from.

    Mobile carries the traffic, which is why the product page work was mobile-first. Bringing it in was the media side of the team.

    Sessions by device

    Sessions by social platform

    Sessions by city

    Retention

    Repeat purchase, by cohort.

    Months since first order run across the top. The spike in month one is the subscription programme renewing.
    Repeat-purchase rate by cohort and months since first order
    CohortCustomers01234567
    Jan 202610,1005.77%69.05%30.29%16.02%11.2%8.98%6.13%4.61%
    Feb 20267,2821.05%74.67%29.01%16.12%11.31%8.65%5.76%no data
    Mar 20266,9208.02%68.13%26.38%13.56%9.5%7.32%no datano data
    Apr 20264,0871.44%76.87%26.37%14.09%9.37%no datano datano data
    May 20269,6263.16%74.54%27.2%14.77%no datano datano datano data
    Jun 20264,8861.92%73.61%30.88%no datano datano datano datano data
    Jul 20264,1424.68%69.48%no datano datano datano datano datano data
    Aug 20264,2653%no datano datano datano datano datano datano data

    Figures were read on 19 September 2026. Screenshots of the source dashboard are in the results section on the homepage. Nothing here is modelled or projected: where a prior-period number is shown it is derived from the change reported on the dashboard, and labelled as such.