By Cristian Daron
A test result is a range, not a number. The headline figure is the middle of that range, and the edges are where the decision lives. Here are three tests from the Puur Smile programme, run in Intelligems, read the way I read every test.
Express payment methods: an established win
Adding express payment methods to the product page, above the fold, lifted conversion 24.89%, from 2.03% to 2.54% across 28,073 visitors over 11 days. The interval on that change ran from +7% to +45%, entirely above zero. Both arms saw the same traffic, so ad spend cannot explain the difference. Revenue per visitor moved with it, but its interval just touched zero, and order value was flat, so the gain was more buyers rather than bigger baskets.
A real scarcity counter: probable, not proven
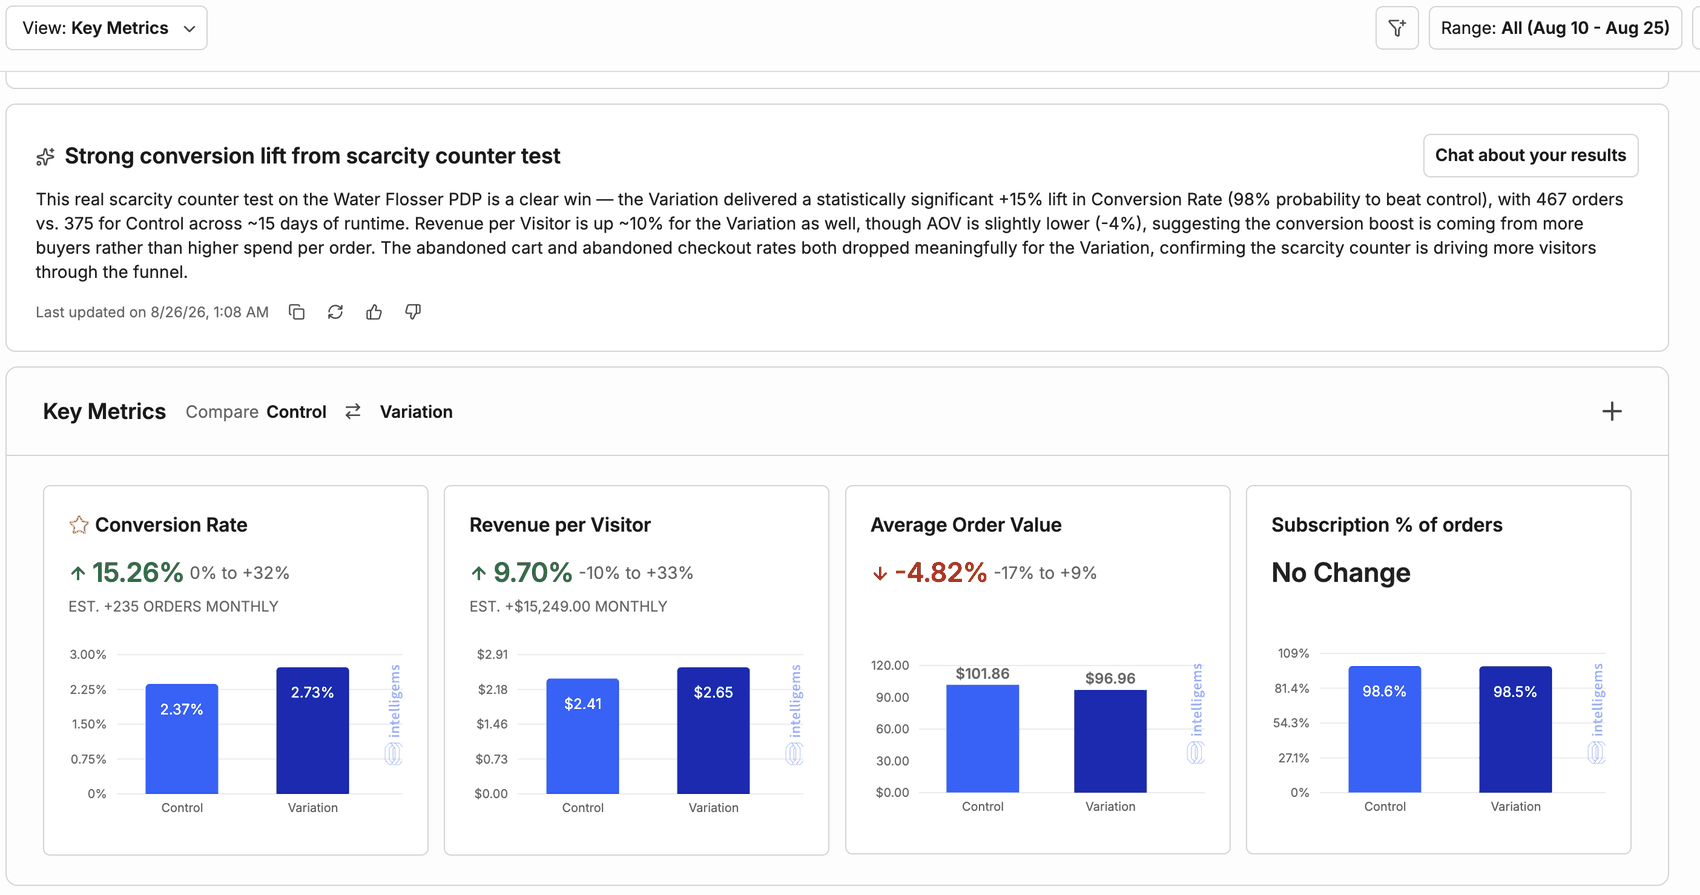
Replacing a static low-stock message with a counter driven by actual inventory lifted conversion 15.26%, at 98% probability to beat control, and the platform's summary called it significant. The interval underneath ran from 0% to +32%, so its lower edge sat on zero. That is probable, not proven. Order value dipped and its interval spanned zero. We shipped it on that basis, with order value kept under watch.
A pricing test that never separated
Half of traffic went to a variant of the product page with a higher price. Conversion, revenue per visitor and order value all had intervals spanning zero, at 66.1% probability to beat control, on 216 to 238 orders per arm. That is not enough to call. What did move was the unit economics: the platform's summary put revenue per unit up 42% on 27% fewer units per order. That is a reason to re-run with a larger sample, not a result to act on, so the price stayed where it was.
The rule I work to
If the interval crosses zero, or reaches down to it, the effect has not been demonstrated, however good the headline looks. I also leave out the platform's projected monthly revenue, because it extrapolates from metrics whose intervals cross zero. A testing programme that only reports its winners is not a testing programme.